Will this PDF
come out clean?
A real result
This is what conversion gives you
The output of a real PDF put through the service. Not a hand-made example.Drag the handle to lay the original and the result over each other.
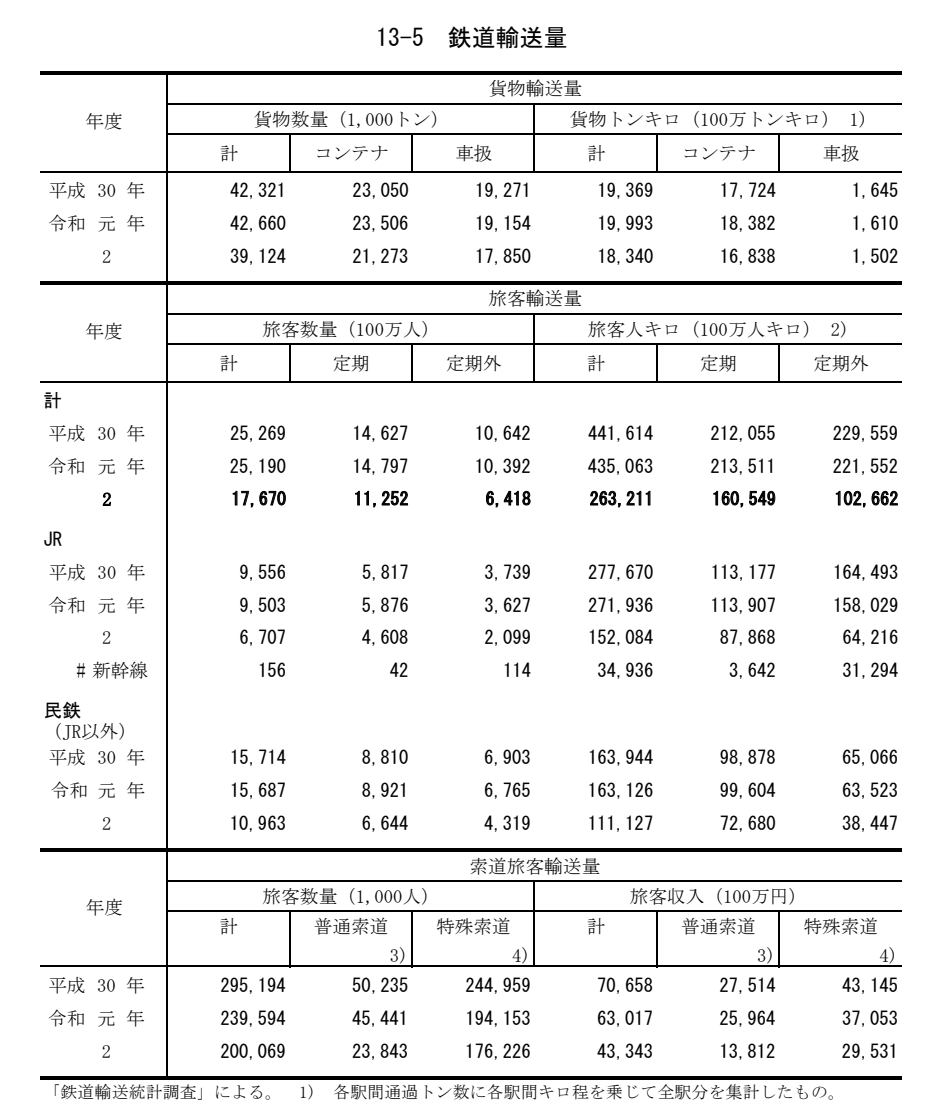
| 年度 | 貨物輸送量 | |||||
|---|---|---|---|---|---|---|
| 貨物数量 (1,000トン) | 貨物トンキロ (100万トンキロ) 1) | |||||
| 計 | コンテナ | 車扱 | 計 | コンテナ | 車扱 | |
| 平成 30 年 | 42,321 | 23,050 | 19,271 | 19,369 | 17,724 | 1,645 |
| 令和 元 年 | 42,660 | 23,506 | 19,154 | 19,993 | 18,382 | 1,610 |
| 2 | 39,124 | 21,273 | 17,850 | 18,340 | 16,838 | 1,502 |
| 年度 | 旅客輸送量 | |||||
| 旅客数量 (100万人) | 旅客人キロ (100万人キロ) 2) | |||||
| 計 | 定期 | 定期外 | 計 | 定期 | 定期外 | |
| 計 | ||||||
| 平成 30 年 | 25,269 | 14,627 | 10,642 | 441,614 | 212,055 | 229,559 |
| 令和 元 年 | 25,190 | 14,797 | 10,392 | 435,063 | 213,511 | 221,552 |
| 2 | 17,670 | 11,252 | 6,418 | 263,211 | 160,549 | 102,662 |
| JR | ||||||
| 平成 30 年 | 9,556 | 5,817 | 3,739 | 277,670 | 113,177 | 164,493 |
| 令和 元 年 | 9,503 | 5,876 | 3,627 | 271,936 | 113,907 | 158,029 |
| 2 | 6,707 | 4,608 | 2,099 | 152,084 | 87,868 | 64,216 |
| # 新幹線 | 156 | 42 | 114 | 34,936 | 3,642 | 31,294 |
| 民鉄 (JR以外) | ||||||
| 平成 30 年 | 15,714 | 8,810 | 6,903 | 163,944 | 98,878 | 65,066 |
| 令和 元 年 | 15,687 | 8,921 | 6,765 | 163,126 | 99,604 | 63,523 |
| 2 | 10,963 | 6,644 | 4,319 | 111,127 | 72,680 | 38,447 |
| 年度 | 索道旅客輸送量 | |||||
| 旅客数量 (1,000人) | 旅客収入 (100万円) | |||||
| 計 | 普通索道 3) | 特殊索道 4) | 計 | 普通索道 3) | 特殊索道 4) | |
| 平成 30 年 | 295,194 | 50,235 | 244,959 | 70,658 | 27,514 | 43,145 |
| 令和 元 年 | 239,594 | 45,441 | 194,153 | 63,017 | 25,964 | 37,053 |
| 2 | 200,069 | 23,843 | 176,226 | 43,343 | 13,812 | 29,531 |
Measured on this page: 124 of 125 numbers matched (99.2%). One is off. The document is a Japanese statistical yearbook.
How we handle accuracy
We never mix what we read with what we guessed
Every value we output carries one of three labels. Text and tables are read from the document and cross-checked against its own text layer where one exists. Charts without printed numbers are estimated from the shape of the bars and lines, and are always marked as estimates. Anything we could not read is left out rather than guessed — because a wrong number that looks confident is worse than a gap.
Charts are our weak spot. When a chart prints no numbers, the values come from the height of the bars and the shape of the lines. We do not treat those as facts: they are shown as estimates. If you need chart numbers you can rely on, this is not the tool yet. Several charts combined into one figure are out of scope.
Pricing
You know the price before you commit
A one-off charge per document. No account needed. All output formats (Excel, Word, Markdown) are included, and you can export as many times as you like.
| Pages | One-off | With credits |
|---|---|---|
| 1〜10 | $1.50 | $0.039 / page100 credits $3.90 |
| 11〜30 | $2.90 | $0.039 / page100 credits $3.90 |
| 31〜60 | $4.99 | $0.039 / page100 credits $3.90−21% |
| 61〜100 | $7.90 | $0.039 / page100 credits $3.90−50% |
| 101〜200 | $13.90 | $0.028 / page300 credits $8.50−38% |
| 201〜 | — | Credits (prepaid) |
Credits are prepaid, 1 credit = 1 page. Whatever you don't use stays for your next document (valid 180 days from purchase, account required).
The check is free. You only pay to convert, and there is nothing more to pay afterwards.
How it works
The cause, and the fix
Why it happens
The cause is that a PDF has no notion of a table. Its contents are just instructions: "draw this character at these coordinates", "draw a line here". To the eye the rules and the numbers form a table; inside the file they have no relationship to each other. Copying simply picks up characters in drawing order, and that is where the row-and-column correspondence is lost.
How we fix it
So the structure has to be reconstructed from the coordinates. PDFIntact analyses the layout to work out which cell belongs to which row and column, and where cells are merged, then writes them out as real merged cells in Excel.
By symptom
More about your symptom
Different causes need different fixes. Start with the one that matches.
- Copying produces garbled textThe font's lookup table is missing. Paste your text and we'll tell you
- Tables shift when pasted into ExcelA PDF has no table structure. We rebuild rules and merged cells
- Text cannot be selected or copiedIt is a photo of paper. We read it with character recognition
- You need the numbers behind a chartRead values and estimated values are kept clearly apart
- Formulas fall apart when copiedA PDF holds no structure for a formula. We keep the notation intact
- Two columns come out interleavedA PDF holds no structure for a column. We put it back in reading order
- A continued table splits at every pageA PDF records no continuation across pages. We join it into one table
Stay in touch
Get notified
We'll let you know about accuracy improvements and new output formats. The check itself is free and needs no account.
Used only for these updates. You can unsubscribe at any time.